Regression
Regression is fitting a bunch of data points with a curve. The data are $xy$-coordinate pairs:
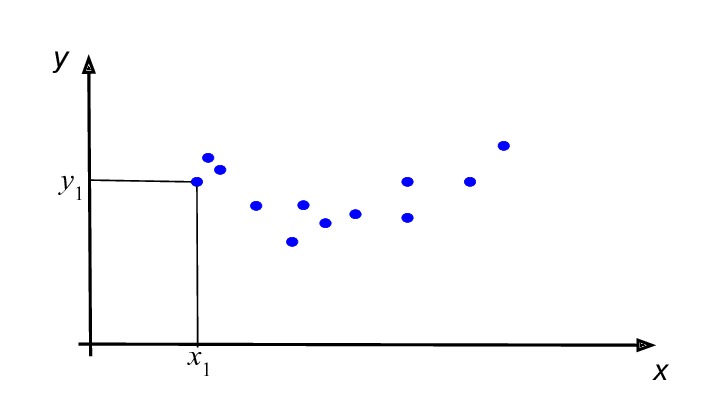
The purpose of regression is to predict the $y$-values for new $x$-values consistently with the given data.
The steps of regression
The two steps of regression are:
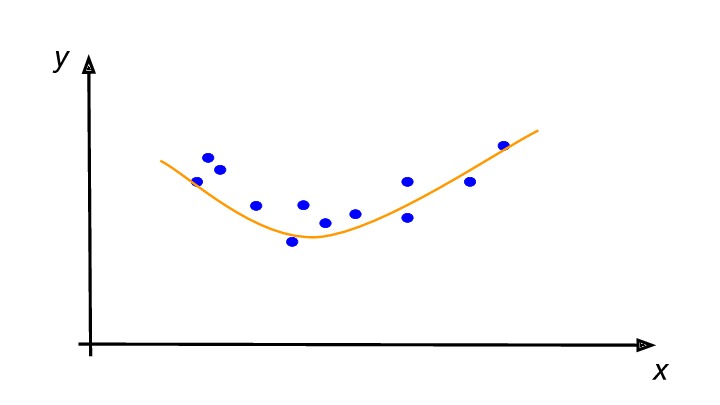
Step 1: Choose the type of curve we want to fit the data with.
Step 2: Find a particular curve of that type that is a closest fit.
We will explain these below.
More about each step
As you might have guessed, there are different types of curves. Two examples are:
| Linear: $ y_{LIN} = {\bf m} x + {\bf b} $ | Quadratic: $ y_{QUAD} = {\bf a} x^2 + {\bf b} x + {\bf c} $ |
|---|---|
 |
 |
There are also other types, but we won’t need to go into them here. Choosing the type of curve to fit the data is something of an art that one gets better at with experience.
Each type of curve is defined by the parameters in its formula. Here are the parameters for linear and quadratic types:
| Curve type | Parameters |
|---|---|
| Linear | slope ${\bf m}$ and $y$-intercept ${\bf b}$ |
| Quadratic | coefficients ${\bf a}, {\bf b}, {\bf c}$, with ${\bf a} \neq 0$ |
Say in Step 1 above, we chose the linear type. To do Step 2 for this choice, we first write the sum
(This sum measures “how off” the linear fit is for the particular values ${\bf m}, {\bf b}$.) For Step 2, we would then find the line that is a “closest fit.” This means that we would find the values ${\bf m}, {\bf b}$ that minimize the sum $S({\bf m}, {\bf b})$. The formula for these values is already known and is already programmed into Excel and other software.
If instead of the linear type we chose the quadratic type, we would be minimizing the sum
with respect to ${\bf a}, {\bf b}, {\bf c}$. This minimization is also already programmed into Excel and other standard software.